
Detailed numerical modelling was conducted to analyse the potential of various cropping systems to sequester soil organic carbon (SOC). Results of this modelling provide input to the website developed to provide a basic, user-friendly tool to demonstrate the potential of cropping systems that follow Conservation Agriculture (CA) principles to sequester SOC.
1. Modelling approach
The field-scale modelling approach followed was based on region-specific climate and the range of soils found in a region. The effects of crop rotations, tillage, agronomic and forage practices could be simulated in detail for region-specific biophysical properties that include climate, soil, water and vegetation.
A GIS-modelling approach was not followed for this study. GIS models need large spatially distributed data sets, which are not readily available for input to this modelling. A GIS based model that is not coupled with numerical modelling is unlikely to simulate the effects of crop rotations, tillage and agronomic practices to a level of detail that can predict how the SOC contents (and stock) will change over time. The compilation of spatially distributed databases that accurately represent the biophysical conditions, farming systems and practices found in each field in a region would considerably exceed the budget allocated for this project. The GIS model version of the EPIC model will depend on future data availability and funding. An upscaled model could transition from demonstrating potential to detailed analysis of how SOC content could change both spatially and over time in a grain production region.
2. Model review and selection
Fourteen (14) numerical models that can predict the effects of crop rotations, tillage, agronomic and forage practices, and biophysical properties on SOC were evaluated. The Windows interface of the EPIC (Environmental Policy Integrated Climate) model (WinEPIC) was selected as a suitable model for this study for the following reasons:
- WinEPIC is freeware, and model code is downloadable from https://epicapex.tamu.edu/epic/winepic/ or from the dedicated home page https://epicapex.tamu.edu/model-executables/winepic-6-0/.
- The model is well documented (how processes are simulated and the equations used, and how the model was constructed), which can be downloaded from http://agrilife.org/epicapex/files/2015/05/EpicModelDocumentation.pdf.
- WinEPIC has user manuals, which can be downloaded from the home page listed above or http://agrilife.org/epicapex/files/2013/02/WinEPIC.0810.Manual.pdf.
- WinEPIC can predict the effects of crop rotation, tillage, agronomic and forage practices for various crop system scenarios.
- WinEPIC is user friendly and allows relatively easy set-up of model input files to simulate a range of farming systems.
- An extensive database on crop growth and development, tillage implements, agronomic, tillage and forage practices provides appropriate default values to guide the set-up of model input files for the summer grain regions.
- For potential future studies the model can up-scale from field-scale to regions with the GIS based version.
3. Model description
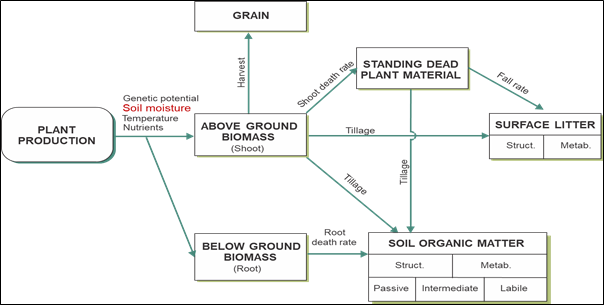
The soil organic matter (SOM) module of WinEPIC is based on the CENTURY soil organic matter model of Parton et al. (1992). The CENTURY model simulates the SOM processes and dynamics to predict the extent of SOC loss or sequestration. According to Smith et al., (1997), the CENTURY model produced consistently low errors for all datasets in a comprehensive study that compared the performance of soil organic matter models against results of long-term experiments. Important processes and components simulated in the CENTURY model, which the WinEPIC SOM module is based on, are shown in Figure 1.
Model documentation that discusses how processes are simulated, the equations that are used and how the model was constructed can be downloaded from the webpage by following the link provided in Section 2. The model user manuals can also be downloaded from this webpage.
4. Model input
4.1. Summer grain production regions
Production regions include Northwest Province, North-western Free State, Northern Free State, Eastern Free State, Eastern Highveld (Mpumalanga Province), KwaZulu Natal and smallholder farmers in the Bergville district of KwaZulu Natal (Figure 2).

These regions reflect the range of climate, soils, crop rotation systems, tillage and agronomic practices for grain production in summer rainfall areas of South Africa. The Northwest Province region was split in eastern- and western subregions for modelling purposes to better represent the range in precipitation, soil properties and crop systems across the province.
The website includes a page for each summer grain production region that contains information on model input used, model calibration, and potential effects of crop system scenarios to sequester SOC. Graphs are included that shows how carbon sequestration potential changes over time in the region when CA farming systems are introduced.
4.2. Climate
A climate dataset with daily data on climate variables was prepared for each region. The climate data conforms to regional monthly mean distribution maps of the South African Atlas of Agrohydrology and Climatology by Schulze et al. (1997). Climate input for a region is discussed in the region’s page.
4.3. Soil
Information on selected soil properties was obtained from the ARC-ISCW Digital National Soil Profile Database (Soil Survey Staff, 1972-2010). The database includes descriptions and analyses of a number of soil profiles for each production region.
Suitable soil forms for crop production were identified, and information on these soils was used to determine three representative soils for each region. Representative soils were selected based on particle size distribution. Soil texture was used as the basis to identify representative soils, which also needed to meet the following required modelling criteria:
- Texture does not vary significantly over time.
- Particle size distribution is not significantly affected by tillage, agronomic and grazing practices.
- Texture is a primary soil property that affects the range of soil, physical and chemical properties that are important to soil carbon sequestration.
- Data is readily available.
The field capacity, wilting point and dry density of representative soils were predicted using the sand-, silt- and SOM contents of soils and the Soil Water Characteristics utility developed by United States Department of Agriculture Agricultural Research Service and Department of Biological Systems Engineering of the Washington State University. The utility includes over 3000 soils for which hydraulic properties have been determined. Properties of the representative soils are discussed in the regions page.
4.4. Crop rotation and sequence
WinEPIC needs crop rotation and crop sequence as model inputs. Regional simulations include conventional tillage (CT), current CA practices (current CA) and ideal future (future CA) crop system scenarios. Forage sorghum and rye as summer- and winter cover crops are included in future CA scenarios that provide high forage and root mass to increase the potential to sequester SOC.
4.5. Crop characteristics
The crop database of WinEPIC includes an extensive list of parameter values on crop growth, crop and root development, biomass production, plant nutrient uptake, harvest index and organic carbon and nitrogen ratios of leaves, roots and grain. Database crop parameter values were primarily used for modelling. Parameter values that were available for the study, such as for the harvest index, forage- and biomass were used to refine parameter values contained in the database.
4.6. Tillage, agronomic and grazing practices
WinEPIC requires information on the following farming activities and their schedule (timing):
- Planting.
- Tillage before, during and after planting.
- Fertiliser and lime application.
- Harvesting.
- Grazing.
The application of pesticides is not included in models, since little soil disturbance occurs during applications and the frequency and specific pesticide used can vary between growth seasons. This limits unnecessarily model detail that has no significant effect on SOC balances.
Tillage practices were used to select implements from the model database, which includes detailed description of properties of an implement that affects soil carbon balances; such as tillage depth and crop residue incorporation (mixing into soil) during tillage.
Data on suggested nitrogen, phosphorus, potassium and lime application rates were provided by Grain-SA for each crop system scenario. The rates were adjusted if the modelling indicated that a crop experience a nutrient deficit that limits the potential to sequester SOC. Modelling also indicated that forage sorghum and rye went into a nitrogen deficit to achieve the high biomass production indicated by ASSET research, resulting in that SOC contents stabilised at reduced levels determined by the extent of nitrogen deficit. Proposed nitrogen application rates were adjusted in the model to both sustain high biomass (forage) production rates and to limit the effect of nitrogen deficiency stress on the crops that sequester SOC.
ASSET Research proposed stocking rates of 220- and 145 cattle/ha/day for ultra-high stock density grazing practices during a single grazing for the forage sorghum and rye respectively. Maize residue left after harvesting was also grazed to 50% of the dry mass being removed, as indicated by ASSET Research. WinEPIC also accounts for the loss of maize residues and cover crop forage mass due to trampling of residue and forage into the soil and the benefits of livestock urine and manure deposited during grazing. The default ratio of WinEPIC that 80% of grazed biomass is converted to liveweight was used.
The tillage, agronomic practices and grazing activities, and the scheduling thereof, for the various cropping system scenarios are based on recommendations of Grain-SA and ASSET Research, and are discussed in the respective web page for each region.
5. Model calibration
Model calibration is required to confirm that model simulations realistically represent the system processes that are modelled, to refine model input data or parameters, and to reduce model uncertainties. Where model simulations form part of a study, it has become accepted practice to expand model calibration to include a good modelling practice audit, which includes comment on processes used to select a model and to ensure that model input (and output) data is valid and accurate. Key aspects of good modelling practice include:
- Selection of appropriate model(s) for the purpose of the study: Fourteen (14) numerical soil organic matter models were evaluated to select an appropriate model for this study; which is discussed in Section 2 and Section 3.
- Model data represent the biophysical conditions and management practices of study:
- Model input on precipitation and climate is based on weather data and the mean monthly distribution of the variables of a region (Section 4.2).
- Model input on soil properties are representative of an average-, sandy and clayey textured soils for a region and the analytical data of the considerable amount of soil profiles included in the National Soil Profile Database (Soil Survey Staff, 1972-2010); which is discussed in Section 4.3.
- Input data on a range of model parameters on crop rotation, tillage, agronomic and forage practices, and the scheduling (date of activity) thereof, are based on data collated by GrainSA, ASSET Research and Blue North from farmers, specialist and workshops during Phase 1 and Phase 2 of the study.
- Collation of experimental datasets from field monitoring trials for model calibration, which is discussed in subsequent sections.
- Model verification, calibration and validation: The following model components were addressed in this study:
- Crop growth and development module (Section 5.1).
- Soil organic matter module (Section 5.2).
Climate Action Reserve published a guideline in 2020 on model calibration, validation of models and verification of model inputs and results, where changes in soil organic carbon stock are predicted. The guideline discusses key aspects of model calibration requirements, model validation of the accuracy of the calibrated model, and the use of experimental datasets to compare modelled predictions to monitored data published from field monitoring trials.
The guideline discusses requirements for (field) monitoring trials that should be planned and operated to provide the following information for projects that predict changes in SOC stock:
- Experimental treatments: It should include comparisons of different fertiliser (and lime) application rates, different tillage systems (e.g conventional tillage with and without mouldboard ploughing and CA tillage systems), and comparisons of a mono-crop rotation, multi-crop rotations and crop rotations that include cover crop(s).
- Data: The monitoring must, at least, provide data on:
- Agronomic practices, such as the crop rotation sequence, use of cover crops, tillage practices, planting densities and dates, and effective root depth.
- Tillage practices, implements used and date of tillage, extent of soil disturbance caused by an implement and the amount of residue mixed into the soil.
- Fertiliser and lime application rates should include the type of application, together with data on the method, frequency, and timing of each application.
- Harvesting methods and the amount of residue left after harvesting.
- Residue management after harvesting.
- Stocking density, forage type and quality, grazing time, and rest/recovery periods of grazing practices.
- Soil compaction (e.g. extent and depth of limiting layer).
- Soil textural class and associated clay contents of the soil(s) of the trial site(s).
- Rainfall and climate data during the monitoring trial.
- Peer-review and published experimental datasets that, at least, includes the following:
- Measurements of SOC stock change over time (time series data) using control plots to test the practice farming system.
- Statistically robust repeated measurements of SOC stock change to capture multi-year changes, as farming system(s) effects on SOC may combine short and long-term changes in soil biogeochemical processes.
- Statistically robust measurements from paired monitoring sites leveraging space-for-time analysis methods that approximate multi-year changes that may also be used to validate for SOC stock changes.
- Soil depth(s) at which SOC stock changes were determined for the model to predict SOC stock changes at the corresponding depths.
- Validation dataset for SOC stock change at the depths of measurements to determine the uncertainty of a model’s predictions (model prediction error) and evaluate model fit.
An example of a field monitoring trial setup in South Africa that does meet the above-mentioned requirements is the trials conducted at the Langgewens Experimental Farm near Malmesbury, Western Cape (Strauss et al., 2021). Time series data on SOC sequestration over time and related minimum datasets and information, as listed above, from (benchmark) monitoring field trials were not available to the study to calibrate the SOC model component for the various summer grain production regions. Ideally, field monitoring trials should have been set up and operated in parallel at locations for the drier regions (e.g. western North West Province and North Western Free State), central (moist) regions (e.g. eastern North West Province, Northern- and Eastern Free State), and wetter regions (e.g. Eastern Highveld and KwaZulu Natal) to account for the range in climate, soil and farming systems in the model calibration and validation for the summer grain production regions. Additional monitoring trials can also include those that represent the clayey (black turf) soils found in the Northern Free State, Brits and Rustenburg areas, and for the smallholder farmers.
5.1. Crop growth and development model component
Parameter values in the WinEPIC plant production module were refined until the predicted above ground dry matter and grain yield corresponded with the data provided by ASSET Research. Parameters include the biomass-energy ratio (potential unstressed above ground- and root growth rate per unit of intercepted photosynthetically active radiation) and harvest index (ratio of harvestable yield to the total biomass of a crop). The results of model calibration and resulting refinement of crop parameter input values are summarised in the respective pages of each production region.
5.2. Soil organic matter model component
The SOM model component was verified against available time series data on the loss of SOC (inverse of sequestration) since time series data on SOC sequestration and related minimum datasets and information for model calibration were not (readily) available for the various regions. The study conducted by du Toit (1992) on the effect of cultivation on SOC was used to verify the SOC model component for the purposes of this study. Data from this study was used for model verification for the following reasons:
- It includes study sites at 50 locations that were distributed in all the summer grain production regions, except for KwaZulu Natal. Each location includes 6 sites of cultivated soil and 6 sites of uncultivated soil where composite soil samples were collected, thus a total 600 soil samples were analysed.
- It provides time series data on how SOC content (stock) changed over time for periods of over 50 years.
- The time series data could provide information on the non-linear change in SOC loss that occurred over time for the following stages:
- Initial stage with high rates of SOC loss;
- Second stage at lower rates in SOC loss; and
- Last stage where equilibrium conditions (no- or almost no decline) in SOC content (stock) were reached.
- It includes soil analytical data required for model input in addition to the SOC contents for the studied sites. The study also includes summary of climate data for the sites, which was used in the model verification.
- Study results were published in the South African Journal of Plant and Soil (du Toit et al., 1993; 1994), and discussed in follow-up review articles in the journal (e.g. du Preez et al., 2011; Mills and Vey, 2004).
WinEPIC could predict the time series data on how SOC contents changed over time for the various study sites of du Toit (1992), following model calibration of the crop growth component and mould board ploughing is accounted for that typically occurred before the 1990s without any further refinement of model parameter values for the conventional tillage crop scenario. This model verification therefore confirms that model simulations with WinEPIC could realistically predict how SOC content (in summer grain production regions) changes over time provided that the crop growth component is calibrated and site-specific soil properties and climate conditions are used. This includes realistic predictions on the change in SOC contents for the initial stage with high rates of changes in SOC content, followed by a second stage with lower rates in changes in SOC contents, and the last stage where quasi-equilibrium conditions were reached after e.g. 50 years in the SOC contents. The results of model verification of the SOM model component are summarised in the respective pages of each production region.
6. References
Climate Action Reserve (2020). Model Calibration, Validation, and Verification Guidance for Soil Enrichment Projects. Draft for Public Comment.
Du Toit, M.E. 1992. Effect of cultivation on the organic carbon and total nitrogen in selected dryland soils. MSc Agriculture University of the Free State.
Mills, A.J. and Fey, M.V. 2004. Declining soil quality in South Africa: effects of land use on soil organic matter and surface crusting. SA J. Plant Soil, 21(5):388-398.
Parton W.J., McKoewn B., Kirchner V., Ojima D., 1992. User Manual for the CENTURY model.
Schulze, R,E and Muharaj, M., 1997. South African atlas of agrohydrology and -climatology. Water Research Commission report TT82/96.
Smith, P., J.U. Smith, D.D. Powlson, W.B. McGill, J.R.M. Arah, O.G. Chertov, K. Coleman, U. Franko, S. Frolking, D.S. Jenkinson, L.S. Jensen, R.H. Kelly, H. Klein-Gunnewiek, A.S. Komarov, C. Li, J.A.E. Molina, T. Meuller, W.J Parton, J.H.M. Thornley, A.P. Whitmore, 1997. A comparison of the performance of nine soil organic matter models using datasets from seven long-term experiments. Geoderma 81 (1997) 153-225.
Soil Survey Staff, 1972-2010. Soil profile descriptions and soil analyses data. In: ARC-ISCW Soil Profile Information System. ARC-Institute for Soil, Climate and Water, Pretoria.
Strauss, JA, Swanepoel, PA, Laker, MC and Smith, HJ, 2021. Conservation agriculture in rainfed annual crop production in South Africa. SA J. Plant Soil 1: 1-14.